
今回は、Debugger for Chromeでデバッグする方法を紹介いたします。
VueやReactなどのJavaScript開発でVSCodeを使っているが、どうやってデバッグするのかわからない方はぜひ参考にしてください!
VueやReactの開発を試してみたい方がいれば、こちらを参考にしてみてください!
 クマじい
クマじいわしにも分かるように頼むぞ。
・・・
そこまで難しくないので、早速説明に入っていきますね!!
Debugger for Chromeをインストール!
まずは、Debugger for ChromeというExtensionsをインストールしていきます!
Extensions:拡張機能のこと
Extensionsをインストールすることにより、効率よく開発を行えるようになります!
左のメニューから□が4つあるアイコンを選択します!
検索欄に「Debugger for Chrome」と検索すると、下の画像のようなExtensionが出てきますので、インストールしてください!
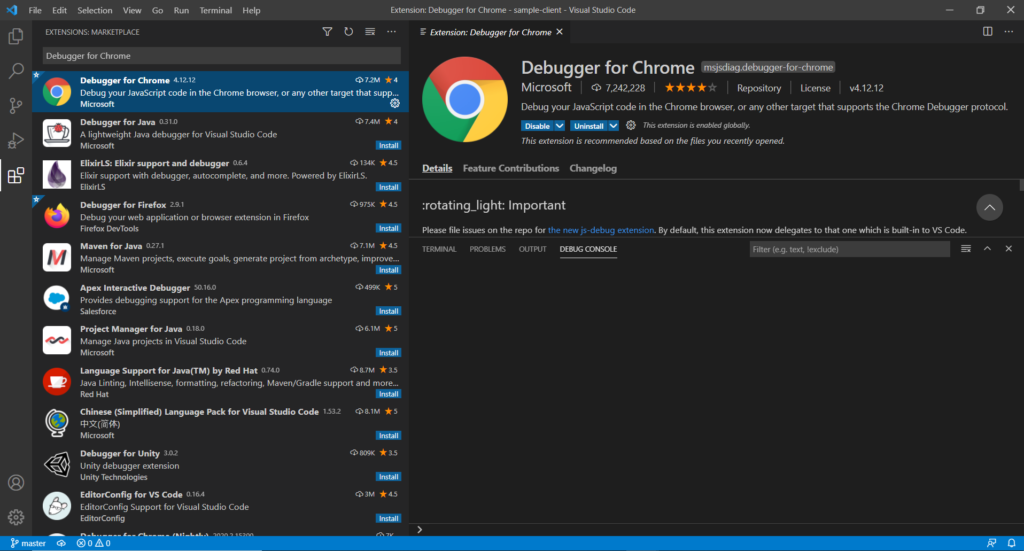
インストールはこれだけです!!
launch.jsonを作成する!
Debugger for Chromeは、インストールしただけでは使えるようにはなりません。
次に、launch.jsonを作成していく必要があります!
まず、左のメニューから▷に虫みたいなアイコンを選択してください!
下の画面が表示されると思います!
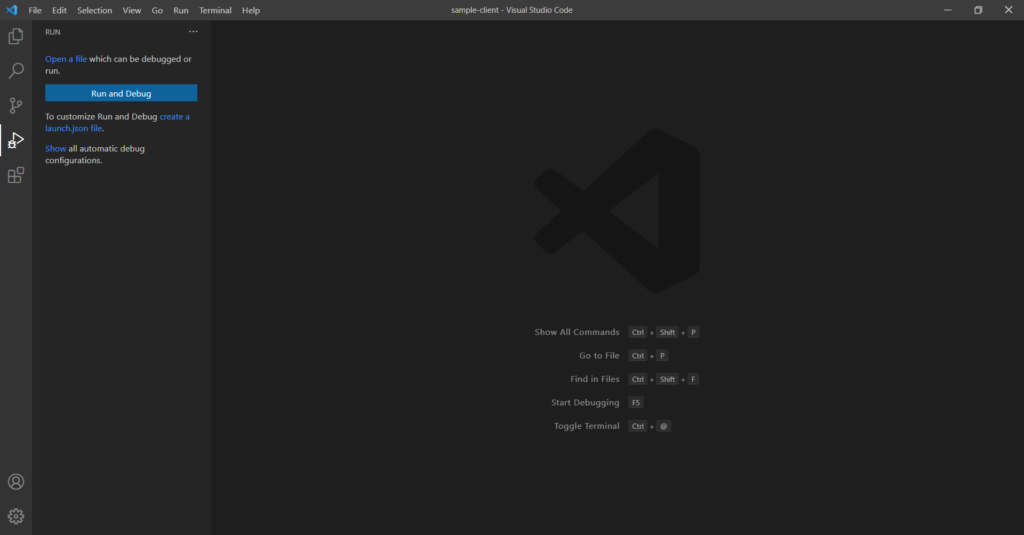
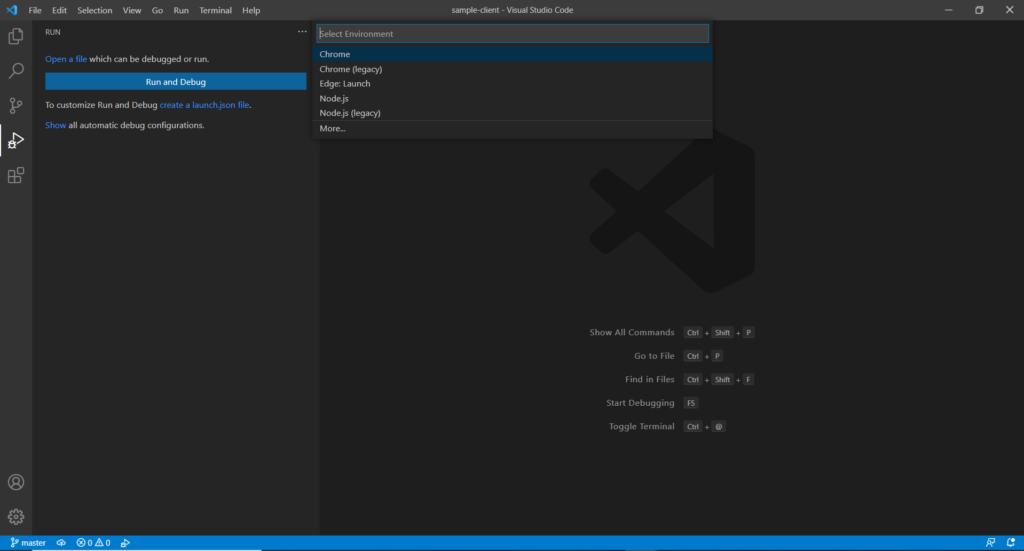
左の表示欄の「create a launch.json file」を選択します。
Select Environmentという欄が出てくるので「Chrome」を選択してください!
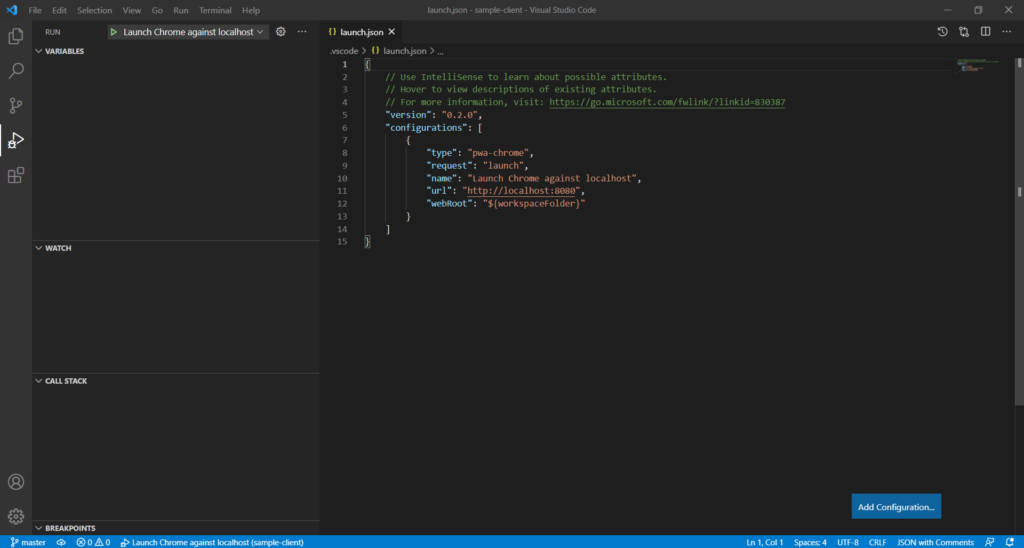
すると、launch.jsonの編集画面が表示されると思います!
基本的にはこのままで大丈夫ですが、「url」には注意してください!
Vueは、デフォルトのポート番号が「8080」なのでこのままでもいいのですが、
Reactはデフォルトのポート番号が「3000」だったり、個別でポート番号を変えている場合は、変更したポート番号に合わせて書き換えてください!
Debugger for ChromeをVueで試してみる!
今回は、こちらで作成しているVueのアプリでデバッグを試してみます!
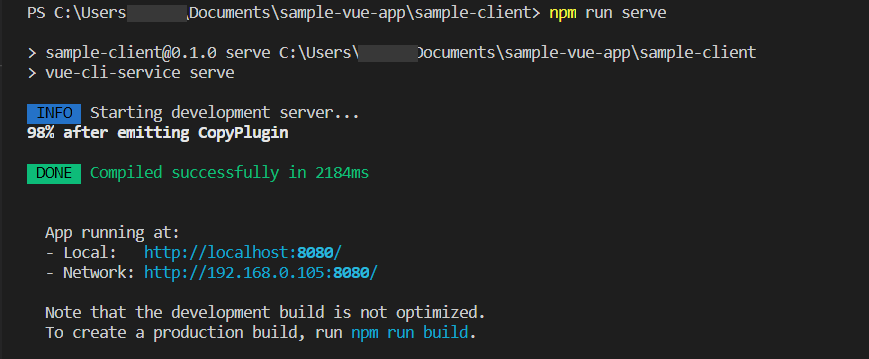
まずは、アプリを実行しましょう!
ここでRunningしているURLと先程のlaunch.jsonのURLが同じであることを確認してください!
実行したら、任意の場所にブレイクポイントを設定して、左上の▷実行ボタンを押します!
すると、しっかりブレイクポイントで止まってくれます!
![File Edit Selection View Go Run Terminal Help
RUN Launch Chrome against localhosl v
v VARIABLES
> Eval
Closure (JsWmain.js)
>
Global
main.js - sample-client - Visual Studio Code
mainjs X
JS
src > JS main.js >
D
1
2
3
4
5
6
7
8
9
import Vue from 'vue
import App from ' . [App . vue '
Vue . config. productionTip
false
ew Vue({
render: h h(App),
}) .$munt( '#app')
v WATCH
v CALL STACK
v maunch Chrome against loc...
(anonymous>
TERMINAL PROBLEMS OUTPUT
DEBUG CONSOLE
[HMR] Waiting for update signal from WDS.
Filter (e.g. text, !exdude)
x
_(webpack) /hot/10%js : 24
PAUSED ON BREAKPOINT
src/main.js 6:1
./src/main . js
local host:8080/js/app.js 114&1
webpack_require
fn
1
localhost:8080/js/app.js
localhost:8080/js/app.js 151:20
localhost:8080/js/app.js 1161:18
webpack_require
checkDeferredModu1es
localhost:8080/js/app.js
localhost:8080/js/app.js
(anonymous>
(anonymous>
>
LOADED SCRIPTS
v BREAKPOINTS
Caught Exceptions
Uncaught Exceptions
main.js src
localhost:8080/js/app.js 925:18
localhost:8080/js/app.js 92&10
6](https://teech-lab.com/wp-content/uploads/2021/02/image-45-1024x550.png)
Debugger for Chromeの使い方は、ここまでです!
Chromeで画面を見ながらデバッグしたいときにおすすめのExtensionです!
まとめ
デバッグできるようになると、エラー原因を見つけるのが楽になったりします!
まだデバッグしたことないよ。。エラーの原因が分からないよ。。という方は、ぜひ活用してみてください!
詳細情報は、Visual Studio Marketplaceで確認することができますので、行き詰まった場合は参考にしてみてください!

VueやReactを初心者の方でも分かるように説明しておりますので、もし興味があれば過去の記事も見てもらえると嬉しいです!